Fishway Performance Meta-Analysis
Original Source: Bunt, C.M., T. Castro-Santos and A. Haro. 2011. Performance of Fish Passage Structures at Upstream Barriers to Migration. River Research and Applications. 28: 457-478.
Abstract
Attraction and passage efficiency was reviewed and compared from 19 monitoring studies that produced data for evaluations of pool-and-weir, Denil, vertical-slot and nature-like fishways. Data from 26 species of anadromous and potamodromous fishes from 6 countries were separated by year and taxonomic family into a matrix with 101 records. Attraction performance was highly variable for the following fishway structures: pool-and-weir (attraction range = 29 – 100%, mean = 77%, median = 81%, vertical-slot (attraction range = 0 – 100%, mean = 63%, median = 80%), Denil (attraction range = 21 – 100%, mean = 61%, median = 57%), and nature-like (attraction range = 0 – 100%, mean = 48%, median = 50%). Mean passage efficiency was inversely related to mean attraction efficiency by fishway structure type, with highest passage for nature-like fishways (range = 0 – 100%, mean = 70%, median = 86%), followed by Denil (range = 0 – 97%, mean = 51%, median = 38%), vertical-slot (range = 0 – 100%, mean = 45%, median = 43%), and pool-and-weir (range = 0 – 100%, mean = 40%, median = 34%). Principal components analysis and logistic regression modelling indicated that variation in fish attraction was driven by biological characteristics of the fish that were studied, while variation in fish passage was related to fishway type, slope and elevation change. This meta-analysis revealed that the species of fish monitored and structural design of the fishways have strong implications for both attraction and passage performance, and in most cases existing data are not sufficient to support design recommendations. Many more fishway evaluations are needed over a range of species, fishway types, and configurations to characterize, optimize and design new fishways. Furthermore, these studies must be performed in a consistent manner to identify the relative contributions of fish attraction and passage to overall fishway performance at each site.
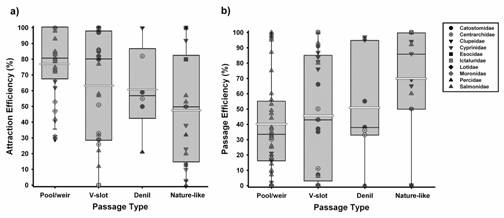
Box and whisker plots for each fishway type, arranged on the x-axis from greatest to least attraction efficiency (a) and least to greatest passage efficiency (b), summarizing maximum, minimum, median (black line) mean (white line) and outlier values, as well as taxonomic patterns of fishway effectiveness
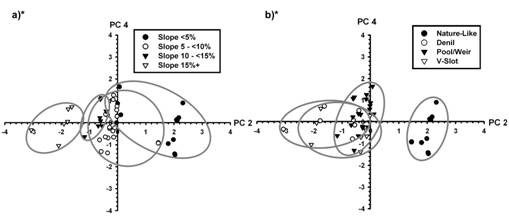
Principal component 2 versus principal component 4, for passed coded by (a) slope and (b) fishway type. Note the separation of nature-like fishways in (b) illustrating the strong influence of technical/nature-like fishways on PC2 (*indicates statistical significance). Each slope interval in (a) spans different fishway types (b), and runs almost parallel to PC2, illustrating its strong influence on overall variability.