Fish Movement at the Springbank Dam - Thames River, Ontario
PHASE 2 - POST-CONSTRUCTION MONITORING - 2009
Summary
A comparison of the data sets from 2006 and 2008 shows statistically, or mathematically significant differences regarding attraction and passage efficiencies. Observations made either directly or videographically suggest that the biological significance of measured attraction and passage efficiencies may differ from mathematical significance. In other words, there was evidence in both 2006 and 2008 that multiple species other than the selected 3 targeted species, move with relative ease over the Springbank dam gates.
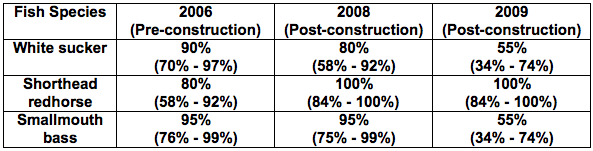
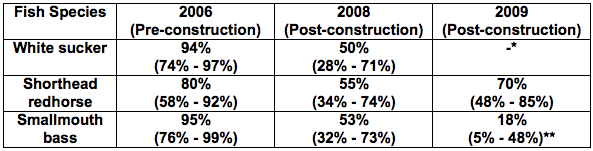
Pre-construction passage efficiencies of all species in 2006 were statistically higher than post-construction passage efficiencies in 2008, as well as in 2009, with the exception of white sucker for which there was insufficient data. These values (reported as efficiency with 95 % confidence interval in parentheses) are:
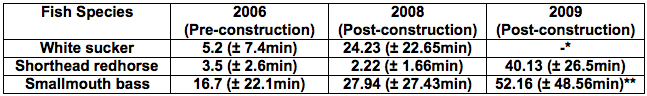
Most fish rapidly approached and swam upstream through the dam structure in 2006. Fish readily approached the dam in 2008, but white sucker and smallmouth bass were more delayed while passing through the dam. In 2009, white sucker data was insufficient to obtain a statistically significant mean value*, but shorthead redhorse and smallmouth bass** were more delayed in passing through the dam. Shorthead redhorse (shaded values) provided the most reliable data, as no unusual circumstances arose during data collection in 2009 or previous years. The mean time (± standard error) required for each species to complete their first pass of the Springbank dam following tagging and release is summarized below:
Environmental factors such as mean air temperature and water temperature, water depth and river discharge as well as lengths of individual fish were recorded in 2006, 2008 and 2009. Statistical comparisons were made from the entire study period and one week after release of each species to determine the possible influence of factors external to dam construction. It was concluded that differences in air temperature, water temperature and water level changes were statistically significant between each year due to the large volume of data collected. However water depths in 2006 upstream from the dam were generally lower than in post-construction years due to the absence of any instream structure. Mean air and water temperatures in 2006, 2008 and 2009 only varied by about 2 °C (with the one exception of the period after smallmouth bass release in 2009) and had a biologically negligible effect on fish behaviour (see glossary for further explanation). Mean river levels (recorded just upstream of the dam by the UTRCA) were generally higher in 2009 compared to 2008 and 2006. However, white sucker and shorthead redhorse experienced similar depth and flow conditions (recorded 1 km downstream from the dam by Environment Canada at Byron) during the week following their tagging and release in all study years. Smallmouth bass experienced depth levels in 2009 that exceeded previous monitoring years by over a meter and flow levels in 2009 that exceeded previous monitoring years by 2 m3/s. This may have affected their passage efficiency, although elevated temperatures during the monitoring period in 2009 were the more likely contributing factor, as detailed below.
The apparent downward trend in fish passage at the Springbank dam may be related to factors other than the dam gates. White sucker data was compromised in 2009 due to vandalism to the antenna array at the dam. Warm water temperatures and higher water levels in the week following release may account for the reduced attraction efficiencies of smallmouth bass.
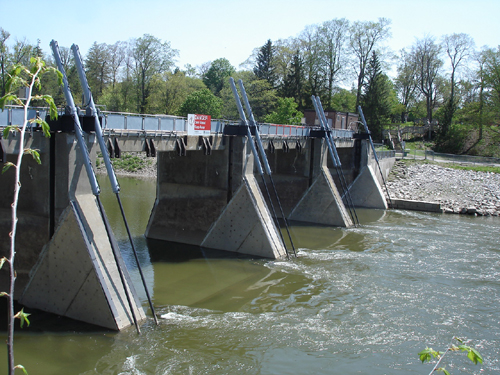
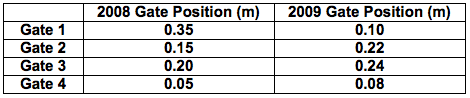
There was evidence in both 2008 and 2009 that flow reversals and back eddys created by the flow of water over the downstream lip of each gate, is negatively affecting fish passage. However, these observations are complicated by the varying gate positions that occurred during the fish monitoring. Positions of each gate edge above the riverbed in 2008 and 2009 were:
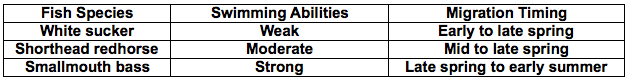
Further monitoring is required in 2010 and perhaps 2011, with larger sample sizes of radio-tagged individuals at the same time of the year as previous studies, if possible. The same species are recommended due to their different swimming abilities and migration times (see table below). These additional data are required to refine statistical comparisons related to baseline fish movement conditions.